Call us today: 317-740-0123

RFID Labeling

Possible Reasons Why Walmart and Dick’s Sporting Goods Want Full-Scale RFID Labeling

Since RFID operates on a radio frequency, it does not need to physically “see” the codes it is reading, unlike a barcode scanner. This portion of the application is a major time saver, allowing the operator to scan an entire warehouse or retail center of +100,000 items in seconds. Rather than the need to scan +100,000 items in a warehouse, +100,000 times, one-by-one-by-one with a barcode system. Imagine telling your management team that an entire warehouse inventory check took less than 10 minutes, rather than the grueling days or weeks a physical check with a barcode scanner takes!

Why are Retailers Requiring RFID Labels on Products?

Walmart is currently requiring all suppliers of goods in Home Departments, Electronics-Toys-Seasonal (ETS) Departments, and Hardline Departments to use RFID labels on all inbound products; with compliance mandates starting in 2024. Dick’s Sporting Goods is also requesting suppliers of goods in most departments use RFID labels on all inbound products as of January 1, 2025. Luckily, our team at Packaging Validators has multiple factory-direct RFID label manufacturers here in the USA, to help our clients stay in compliance.

Still, many of our Packaging Validators clients have asked us “why are they doing this?” We aren’t psychic (yet), but here are our thoughts on what the push is all about.

  • Inventory Accuracy: The well-established equation for inventory is shipped products to stores – cash register sales = retail inventory.

Challenge: This equation does not account for theft, misplaced inventory, or incorrectly scanned merchandise.

  • Sales: If the product is correctly located to be within the store planogram, it is more likely to be found and sold. Likewise, if the consumer can find the correct size, color, flavor, SKU#, located in the correct area, the consumer is more likely to find and buy. They are also more likely to return to that store for the convenience of proper organization.

Challenge: If the product is in a display, action alley, back stock room, return service counter, or anywhere else in the store outside of the planogram, the retail associates and consumers cannot locate the desired item; more than likely resulting in a lost sale and if happening frequently enough, potentially a frustrated or lost customer.

  • Ecommerce and Online Competitors: With the rapid growth of Amazon, American consumers appear to crave more and more convenience; and convenience these days means click button, buy item, item shows up within 12-48 hours, all without leaving the comfort of the couch. Amazon is also using automatic price comparisons at other retail stores, reducing the need to look for “the best price.”

Challenge: Amazon doesn’t have consumers wandering through warehouses and moving products around. No consumers picking them up, putting them in a cart, and putting them back in the wrong place or shop lifting them.

Solution: If Walmart and Dick’s can ensure accurate inventories, then they can compete with Amazon by having same-hour / same-day pick-up or delivery if inventory is nearly 100% accurate.

  • Replenishment Speed: Once a consumer puts a retail product in their cart, another consumer cannot buy it out from under them (with socially acceptable manners).

Challenge: Traditional bar coding doesn’t subtract the item from inventory until it’s purchased at the cash register.

Solution: RFID can be set up to allow for replenishment as soon as the item is depleted from the shelf. If not returned to the correct shelf, RFID can help quickly locate the misplaced item.


Of course, there are other reasons management teams, investors, and executives are looking into RFID as an option for their businesses. The trend is that RFID will continue to rapidly grow. Adoption rates of RFID Label Compliance Mandates are rapidly increasing, and raw material costs continue to decrease. RFID is nothing new, but it is here to stay.

Let us know how our team at Packaging Validators can help your company with RFID label compliance, sourcing factory-direct domestic RFID labels, procuring RFID label application equipment, or procuring RFID label reading equipment and software.

Give us a call at 317-740-0123 or schedule a quick 15-minute meeting with us using the Calendly Link: https://calendly.com/chris-validatorsllc/15min

Conveniently located in the USA – 755 W. Carmel Drive, Suite 216, Carmel, IN 46032


Blog Sources and Additional Information


RFID Labels and Barcode Systems

Quick History of RFID Labels and Barcode Systems and The Growth of RFID

Quick History of RFID Labels and Barcode Systems and The Growth of RFID

These days, there are a lot of discussions around the “novelty” of “magic” RFID technologies. Not to burst any bubbles, but RFID is nothing new. For 23 years, I have sold RFID labels to companies looking for solutions on quickly checking inventory, rather than the inventory standard of barcoding systems. So, if RFID has been around, why are we just now buzzing about RFID?   

History on RFID Labels

With roots tracing back to WWII (the Germans used a crude method of RFID to help them see which airplanes were theirs) and origins all the way back to 1935 (physicist Sir Robert Alexander Watson-Watt), Radio-Frequency Identification (RFID) has been rapidly adapted as a valuable tracking tool for many industries. Like most technology, the early stages of RFID (1940’s and 1950’s) were mainly utilized for military and aerospace efforts. In the 1960’s, companies started utilizing RFID for merchandise tracking solutions or theft prevention. The 1970’s was the first big explosion of RFID technology. With companies like RCA expanding research efforts and multiple other avenues like rewriteable (Mario W, Cardulla) and passive (Charles Walton) RFID tags, the sky seemed to be the limit. However, RFID didn’t initially takeoff in the mainstream market…

What About Barcodes?

Figure 1: Wrigley’s Chewing Gum at Marsh

Barcodes were initially invented in 1949 (by Norman Woodland and Bernard Silver) as a “Classifying Apparatus Method,” for faster checkout times and fewer pricing errors from manual input. Barcoding was first commercially utilized in the 1960’s with recognized industry standards coming into play in the 1970’s. The Uniform Product Code (UPC for short) was introduced in 1973 and in 1974 was officially adopted and installed in the supermarket Marsh for Wrigley’s Gum (in Troy, Ohio). This is the universally familiar series of bars and spaces we know today.

However, there are limitations to barcode systems. To name a few: barcodes require the barcode reader (or scanner) to physically “see” the code it is scanning, there is still human error in scanning the wrong barcode, and the extraordinarily time consuming and repetitive process of scanning individual barcodes one-by-one-by-one.

Why did Barcodes Takeoff and RFID Stay Stagnant?

If barcodes and RFID were both born and bred around the same time, why did barcodes leave RFID in the dust? I can’t go back in time and give an exact play-by-play, but I can tell you the most

Figure 2: Sir Robert Alexander Watson-Watt with the first RFID reader.

likely reasons based on my 35+ years of label and packaging experience. One of the largest drawbacks for RFID were the hardware and software limitations prior to the 2000’s. Since RFID utilizes radio frequencies, there were more issues with High Frequency readings, and with reading frequencies through liquids or metals. As with most new technology, the hardware required to create the RFID labels (chips and antenna) were not in a price range that many companies were willing to invest in. Additionally, the software systems required to maintain the RFID’s data were expensive, massive, and rudimentary.

So, why is RFID just now seeming to takeoff?

A mix of technological, economic, and social changes over the last 5-10 years have made RFID a much more attractive and beneficial option. Massive software advances have made it easier to utilize and maintain RFID readers and systems. Computers went from the size of warehouses to the size of the ones we keep in our pocket every day (cell phones). From an economic standpoint, the raw materials needed to create the RFID chips and antennas are now less expensive and more accessible; more companies are willing and eager to invest. We also had the COVID era that ushered in a “touchless technology” ideology. While this is less pertinent, the touchless tech age is expanding advances in RFID and similar technologies (NFC, BLE, UWB, QR Codes, Etc.), increasing desire and accessibility even further. Another way to look at it are all the analogies between land-line phones (barcodes) and cellular/mobile phones (RFID).

Fast-forward to today, barcodes can be supplemented and/or complemented with an RFID label.

Let us know how our team at Packaging Validators can help your company with RFID label compliance, sourcing factory-direct domestic RFID labels, procuring RFID label application equipment, or procuring RFID label reading equipment and software.

Give us a call at 317-740-0123 or schedule a quick 15-minute meeting with us using the Calendly Link: https://calendly.com/chris-validatorsllc/15min

Conveniently located in the USA – 755 W. Carmel Drive, Suite 216, Carmel, IN 46032

Blog Sources and Additional Information

Recycling Plastic Bags

Sustainability – Reducing landfills by recycling plastic bags

Studies show around 85% of single use plastic ends up in our Landfills or as unregulated waste.

How can you help?

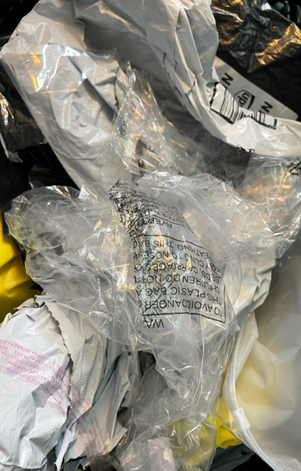
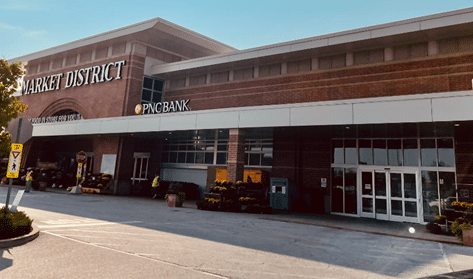
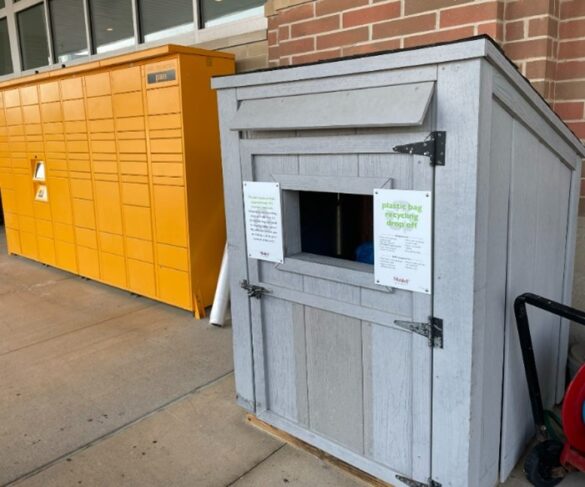
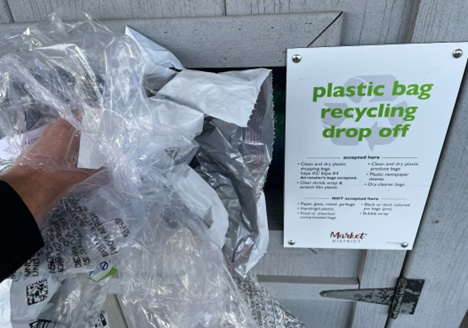
Plastic bags, shrink film, stretch film, plastic grocery sacks, produce bags, produce bags, and clear plastic Amazon mailer bags can all be dropped off at local collection centers and many grocery stores. By participating, you can contribute to a Zero Landfill life-style!


 It only takes a little bit of effort to collect your plastic bags and drop them off regularly!


Composting

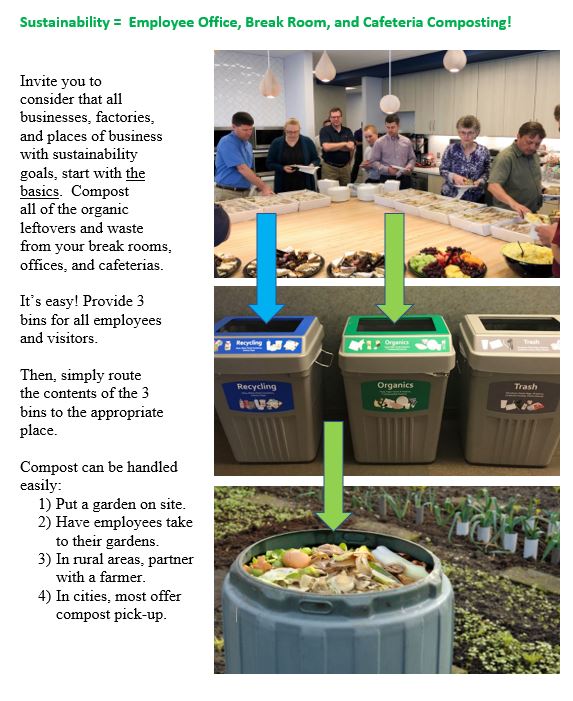
Sustainability Basics start at home and office with composting

Christmas trees

Zero land-fill = buying live Christmas trees vs. fake trees

Recycle paper and corrugated boxes at home

During the Christmas season, it is easy to get caught up in “convenience”.  It’s convenient to just throw all your boxes and gift-wrap in the trash.   At Validators, we encourage you to recycle all of it.   It can all be used in the making of more paper and packaging products.  When trying to improve your sustainability efforts, it’s easy to start with your own personal household efforts.  As a company, you can encourage all of your fellow employees to do the same.

Label Market Watch Q1 2021

Label and Packaging Market Watch

              1st Quarter 2021

                                                                                                                        By: Chris Doerr

This is a report of current market trends in labeling and related industries such

as shrink sleeves and flexible film. There are many ingredients involved

in the manufacture of labels including paper, polypropylene, acrylic acid,

silicone, pigments, and bleaching agents.


  • There is no index or prescribed method to determine raw material costing.
  • There are only a handful of suppliers that control the market.
  • Inflation is almost always present across all raw material inputs.

Prices are currently going up 3-8% due to the following quoted factors:

  • Global supply of polypropylene, acrylic acid, and related adhesive chemical feedstocks.
  • Demand for packaging materials is growing and supply has not kept pace with demand.
  • Transportation costs have increased due to increasing wages and shipyard loading dock worker shortages due to COVID quarantines.
  • The Texas power outage took major chemical refineries off-line; however, the electrical outage created numerous maintenance and re-fire issues that have led to weeks of delays in a market that was already at full capacity.
  • The Suez Canal blockage has global shipping freight sitting at sea and slowing down the supply chain.

Factor #1:    The BIG 6 raw material suppliers.    All have raised prices from approximately 3% – 8%.   2 have claimed Force Majeure:

Factor #2:     Paper costs.     NBSK Paper was $875 per ton in 2017.   It is now $1,220 per ton as of  March 17, 2021.

Source:  PaperFirst.

Factor #3      Plastic resin costs have increased substantially

due to global demand for smart phones,

flat-screen tv’s and monitors, and the TX

power outage created for long shut-downs

affecting 80% of the USA market.

Source:  Plastics Today

 Factor #4:   Platinum costs in the manufacture of silicone for release agents.

Currently trading around $1,200 per ounce vs. around $950 just 2 years ago at the time of the last major increases.

Source:  Kitco Metals

Factor #5:  Acrylic Acid and adhesive feedstock chemicals.   Global acrylic acid market share is dominated by BASF, Arkema, Dow Chemical and Nippon who accounted for over 45% in 2014. The industry is moderately consolidated in nature and moving towards developing acrylic acid from bio-based feedstock.

Source:  Grandview Research- Acrylic Acid Market Size Worth $22.55 Billion By 2022

                                                                                                             Source:  Echemi March 31, 2021

Factor #6:   US Dollar exchange rates against the Chinese Yuan and Euro dollar.   A weak dollar buys less in the global market and thus contributes to higher prices.    In 2017, one US dollar bought 1.179 Euros, today one US dollar only buys .85 Euros.     The US dollar has weakened compared to both Chinese and European currencies.   Source:  X-Rates.com

Factor #7:  Overall inflation.  This is a critical factor!   The cost of all goods and services continues to steadily rise year over year.   The Bureau of Labor Statistics shows that the Consumer Price Index is at an all-time high of 263.014.   This means that the same basket of goods that was at $100 in 1982-1984,  is 2.63X higher.

Source:  Consumer Price Index – Bureau of Labor Statistics  data.bls.gov

 Factor #7 continued. More inflation.  The Producer Price Index for papers and packaging has increased over the last 18 months:

 Factor #8  Rising freight rates.  It’s not just the cost of freight to ship to you, it’s the cumulative freight costs within the entire supply chain from the chemical factory; to the paper mill; to the coating facility; to the converter.   Ground freight costs are up 12% vs. a year ago according to FreightWaves.com.     Container costs have increased from $2,200 to $4,000 in the past year.    Sources:  www.freightwaves.com and The Economist.

 The above information is helpful in gaining an overall understanding of the many cost-factors involved in the layers of the pressure-sensitive adhesive “sandwich”.    Each of the 7 layers outlined below has its own supply chain.  There is no index that captures the complete cost variables within each.    We do our best to stay on top of the trends to be at the forefront of appraising you of forecasts.    Please call us at 317-627-4894 if questions.


Sources:

  • Kitco Metals
  • Paper First
  • Plastics Today
  • Grandview Research
  • X-Rates.com
  • Bureau of Labor Statistics
  • Freight Waves
  • The Economist
  • Echemi
  • StLouisFed.org


Delta E White Paper

Delta E – White Paper


The Print Guide

Tolerancing color in presswork – CIE L*a*b* and DeltaE

This method attempts to bring an objective, system independent, instrument-based method to color tolerancing. Because this method uses instruments to define colors, the range of tolerance and deviation from the target it is considered to be objective and unambiguous. It is much more sophisticated than the more subjective methods so far described in my other posts. As a result, a bit of background knowledge about color science is needed in order to understand how this system works and to understand its value and potential pitfalls.

A scientific approach to describing color
From a color science point of view, any color can be described by three basic attributes:

1) Lightness. This is the attribute of a color by virtue of which it is discernible as bright, dark, or somewhere between those extremes.


2) Chroma. This is the attribute of a color by virtue of which it is discernible as purity or intensity of color relative to a neutral color like grey.  Also referred to as “saturation.”
3) Hue. This is the attribute of a color by virtue of which it is discernible as red, green, etc., and which is dependent on its dominant wavelength, and independent of intensity or lightness.
So, from a scientific point of view, describing a color requires three values/numbers.  One for Hue, one for Lightness, and one for Chroma.

Describing a specific color this way can be visualized as finding the location of a specific room in a building. One goes up a central elevator representing the range from neutral dark to light. Then one gets out of the elevator at a specific floor/specific lightness level and travels outward from neutral grey to an increasing amount of chroma/saturation as they move toward the outside edge of the building. Once they reach the desired amount of chroma/saturation one moves to the left or right to find the specific room/hue. So, directions to the specific room/color can be expressed as a recipe: Up X levels (lightness/floor level), Move X Distance (Chroma/Down hallway), Move X degrees (Hue/Along perimeter) = Room/Color.

This three coordinate method of describing a color can be visualized in cut-away form as in this graphic: In reality this 3D color space map is more complicated (you can see a movie of a real 3D color space HERE). However it should be good enough to explain this complex subject.

This three coordinate system (LCh) can then be used to map the location of a specific color. 
Unfortunately, LCh has not been widely adopted to describe a color’s location within a color space. Instead, the less intuitive L*a*b* notation is most commonly used. L*a*b*, more properly written CIE L*a*b* uses the same 3D model but identifies the color according to its “L” lightness, “a*” axis value (+a* = more red, -a* = more green compared to neutral grey) and “b*” axis value (+b* = more yellow. -b* = more blue compared to neutral grey).

Defining a color location using CIE L*a*b* coordinates
Using the three coordinate CIE L*a*b* system allows us to numerically identify any color within a color space. In this example, I’ll use a print color space and identify the desired color within that color space:
Tolerancing a color using CIE L*a*b*
Color tolerancing using CIE L*a*b* involves comparing the measurements, taken with a spectrophotometer, of a color sample (the output) to the data of a known color (the specification or input value). Then the “closeness” of the sample to the specification is determined. If the sample’s measured data is not close enough to the requested color values, it is deemed to be unacceptable and adjustments to the process may be required. 

The amount of “closeness” between two colors can be calculated using a variety of methods. These methods calculate the distance between the two sets of measurement coordinates (e.g. CIE L*a*b* values) within the three dimensional color space. The size of the distance is defined by the size of the tolerance and is expressed as a “DeltaE” value (Delta Error).

To calculate the “closeness” of the specified color and the sampled color, the specified color is pinpointed by its position in CIEL*a*b* color space. Then a theoretical “tolerance sphere” is plotted around the color. The sphere, with the specified color at its center, represents the acceptable amount of difference between the specified color and other measured samples (the color output). The actual size of the tolerance sphere is determined by the customer’s specification’s for acceptable color difference. The tolerance value is expressed in delta (∆) units such as ∆E usually written as DeltaE (delta error). Measured data that falls within the tolerance sphere represents acceptable color. Measured data that falls outside the tolerance sphere represents unacceptable color.

Typical customer tolerances in the graphic arts industry usually range between 2 and 6 ∆E. This means, for example, that samples outside the tolerance sphere lie more than 6 ∆ units away from the specified color. Tolerances less than 2 ∆ units are typically unachievable given normal process variation. Differences between two colors that are up to 4 ∆ units away from each other are usually not visible to most viewers.

Issues, concerns, and caveats when using CIE L*a*b* DeltaE tolerancing
While this method can bring an objective and potentially unambiguous method to color tolerancing there are several issues to be aware of that can cause misunderstanding and error.

1) CIE L*a*b* DeltaE tolerancing is instrument dependent, however, different instruments can deliver different values from the same color sample.
Some of the reasons include: poor maintenance of instrumentation, infrequent recertification by the factory, lack of periodic verification, spectral bandwidth differences, lack of geometric tolerances, variations in fluorescence in the substrate and instrument illuminant, instrument and environment induced noise, dark current drift, variations in ambient conditions, thermochromism (ink changes color due to a change in temperature), hygrochromism (humidity changes the way ink interacts with paper and hence its color).

2) CIE L*a*b* DeltaE values are dependent on the formula used – and there is no universally agreed standard for the formula that should be used.
Some formulas are: DeltaE 76 (sometimes referred simply as DeltaE), DeltaE 94, DeltaE 2000, and DeltaE CMC. In general, DeltaE 76 values are highest, DeltaE CMC values the lowest especially for saturated colors, DeltaE 94 and 2000 are lower than DeltaE 76 but higher than DeltaE CMC.

For example, these two color patches are made up with the indicated CIE L*a*b* values: The DeltaE difference between these two colors as reported by the different color difference formulas:
CIE 76: 7.10 (a large difference – unacceptable)
CIE 94: 1.51 (well within typically acceptable variation)
CIE 2000: 1.57 (well within typically acceptable variation)
CMC: 2.26 (within typically acceptable variation)

So, depending on the formula used to calculate the difference in color a measured sample may, or may not, be within acceptable tolerance.

3) It is harder to see the differences when colors are very saturated. It is easy to see a difference when colors are near neutral.
Formulas like CIE 94 attempt to compensate for this difference in visual color acuity, however, it is not the predominantly used formula. That honor goes to CIE 76. It’s therefore important when discussing color variation to specify which formula is being used to calculate DeltaE values so that the numbers can be better interpreted.

4) The color performance of a system or press sheet is sometimes reduced to a single DeltaE value as a statement of being within tolerance. This can be very misleading since the single DeltaE value is an average of all sampled colors and will likely not reflect the performance of specific critical colors.
Statements such as “This press sheet is within 2 DeltaE of the proof” are virtually meaningless.

5) There are no CIE L*a*b* controls on a press.
If a color on a press sheet is out of DeltaE tolerance – the press operator effectively has to guess at what should be done to correct the problem using tools not designed for this function like solid ink density, water, impression pressure, etc. to effect a change in color.

Written By:

Gordon Pritchard

I’m an artist, photographer, and graphic designer based in Parksville, British Columbia, Canada. Formerly Print Quality Marketing Manager for eleven years at Creo/Kodak. Presented at print technical conferences, trained printers and buyers regarding print quality issues in Europe, N. America, and S.E. Asia. Articles published in trade journals, co-authored TAGA paper on halftone screening, authored BRIDG’s guide to halftone screening. Previously Technical Director of Western Canada’s largest commercial sheetfed shop. For several years Professor of Digital Graphic Design at Emily Carr University. Former Creative Director at McCann Ericksson Vancouver. Always looking for opportunities related to the subjects covered in this blog. I can be contacted at: pritchardgordon @ gmail.com